Coffee, Genes and Gemini: Tracking Caffeine Around the Clock
TL;DR, Show me the App
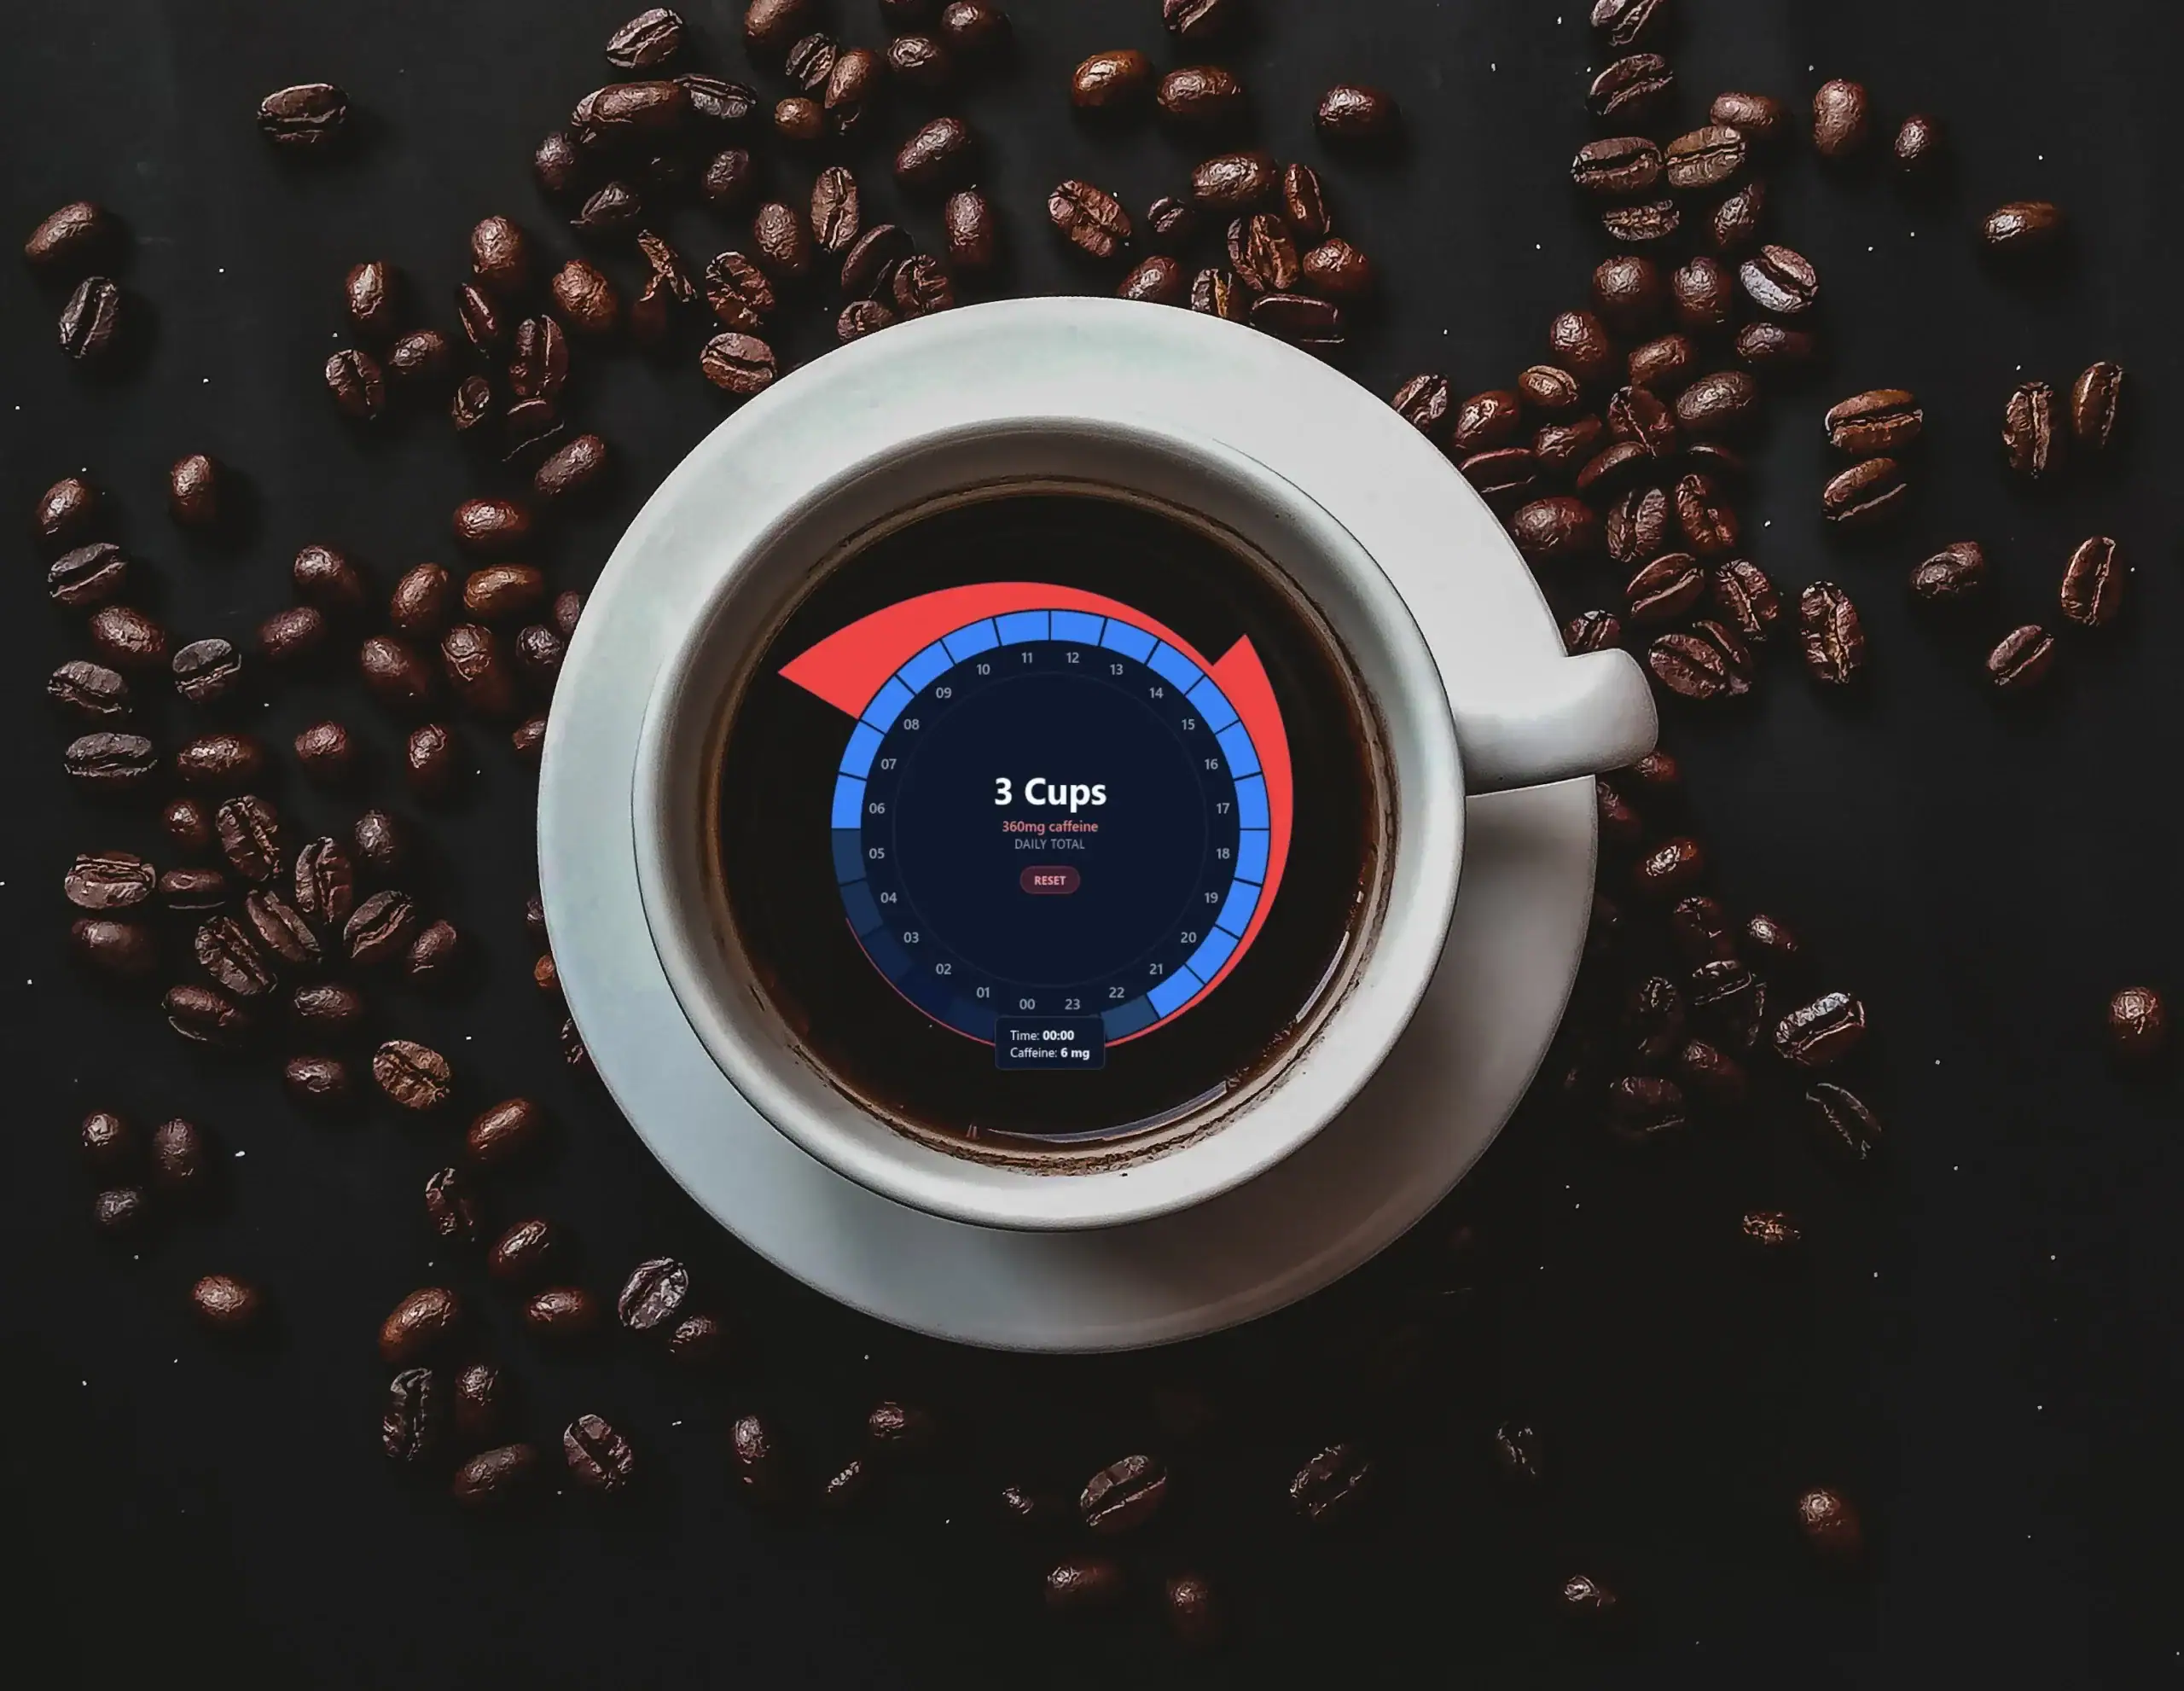
I vibe-coded a 24-hour visual Caffeine Tracker with OpenCode to see exactly how long my daily intake stays in my system. What started as a quick build pulled me down a massive rabbit hole into the biology of coffee metabolism—and resulted in a genuinely useful tool.
Finland’s Favorite Thirst‑Quencher
Finland reliably ranks among the top global coffee drinking countries, with estimates of roughly 9–12 kilograms of coffee per person per year. This works out to around four cups a day for the average adult, and nobody bats an eye even if you triple that. Our law-mandated workplace breaks are universally known as coffee breaks, and though Finns are known to value quantity and effectiveness over quality, when it comes to coffee, coffee remains a national obsession.

I enjoy a few cups of coffee on most days, but sometimes I wonder if it would be beneficial to cut back. Luckily, epidemiology has been reassuring coffee drinkers for years—multiple observational studies suggest that coffee drinking is associated with a lower risk of Alzheimer’s and Parkinson’s, as well as cognitive decline at old age. Still, small risks towards heart problems and insomnia have been noted.1 2 I knew the liver works hard to clean the body of extra chemicals, but beyond the old adage of ‘don’t drink coffee late in the evening’, I didn’t know exactly how it works.
Turns out, coffee metabolism is not simple
I grew curious about how much caffeine is still running through my system, when I go to bed at night. From genetic testing, I know I carry the relatively common CT variant of the AHR gene in rs4410790, which upregulates the transcription of the CYP1A2 enzyme responsible for metabolizing caffeine in the liver (among other things like melatonin and various pharmaceutical drugs)3. This might cut my caffeine half-life from the standard 4-5 hours down to a brisk 3.
Genes are not the only thing affecting metabolisation. Individual variation in how quickly coffee leaves your system is huge (between five- and sixfold!)4. So I read some science.
For the data purists, below is the raw pharmacokinetics of how smoking and oral contraceptives push clearance rates in opposite directions. You can clearly see the distinct groupings in relation to the black control group: blue data points (smokers) cluster higher for caffeine clearance on the left and lower for caffeine half-life on the right. Conversely, the orange data points (oral contraceptive users) sit lower for clearance and significantly higher for half-life.
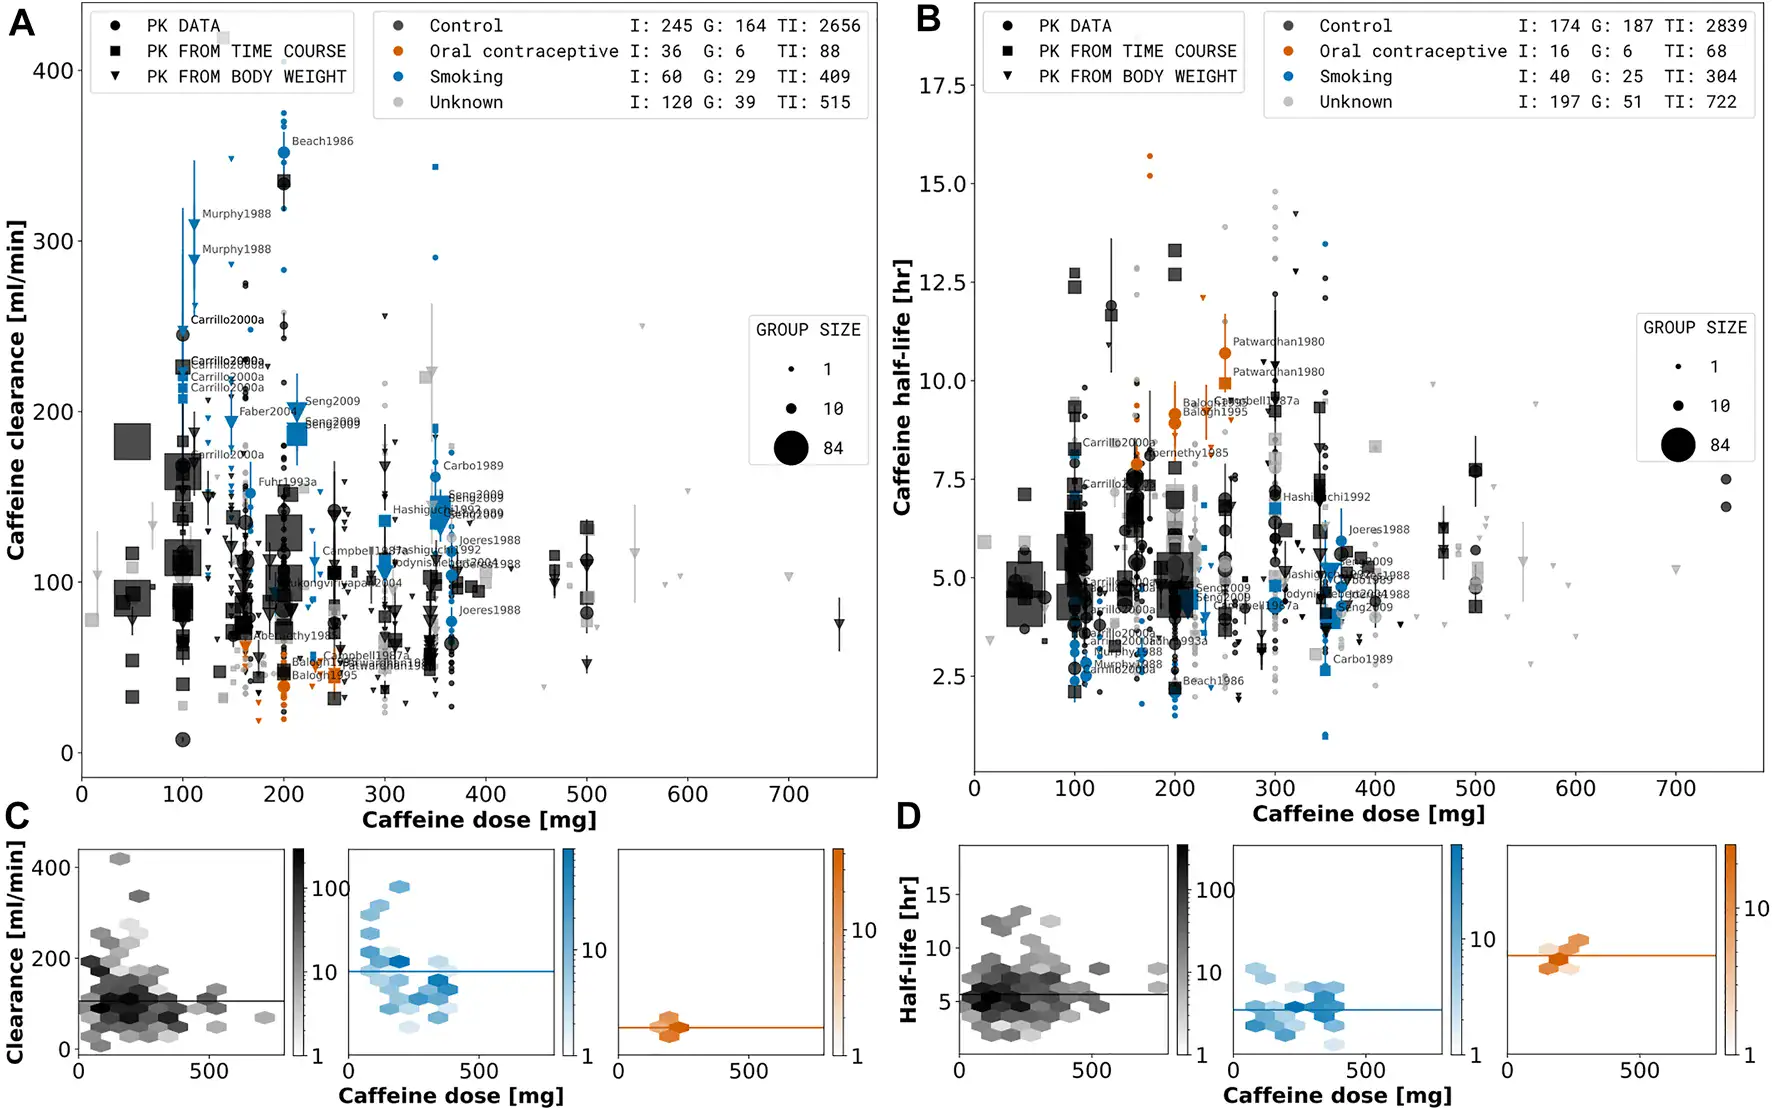
A lot of things affect liver function—smoking is the most powerful CYP1A2 inducer known, and can cut caffeine half-life in half, whereas the use of oral contraceptives has the opposite effect. There are drug interactions—fluvoxamine, pipemidic acid and norfloxacin inhibit caffeine clearance while Tipranavir (a HIV-1 protease inhibitor) shows weak induction of caffeine clearance. I’m guessing you’re told about the effects if you’re prescribed the specific SSRI or antibiotic. Logically, diseases that affect the liver also inhibit caffeine clearance. You also metabolize caffeine slower if you’re obese.
Naturally, different drinks have different amounts of caffeine. But coffee is not just coffee, either—the exact type of bean, preparation method and brewing time have an enormous effect on how much caffeine is ingested. Caffeine numbers range from 0 – 150mg for different tea brands to 50 – 400 mg for most types of coffee. Some crazy coffee brands go for over 1000mg per cup!
Caffeine Tracker App
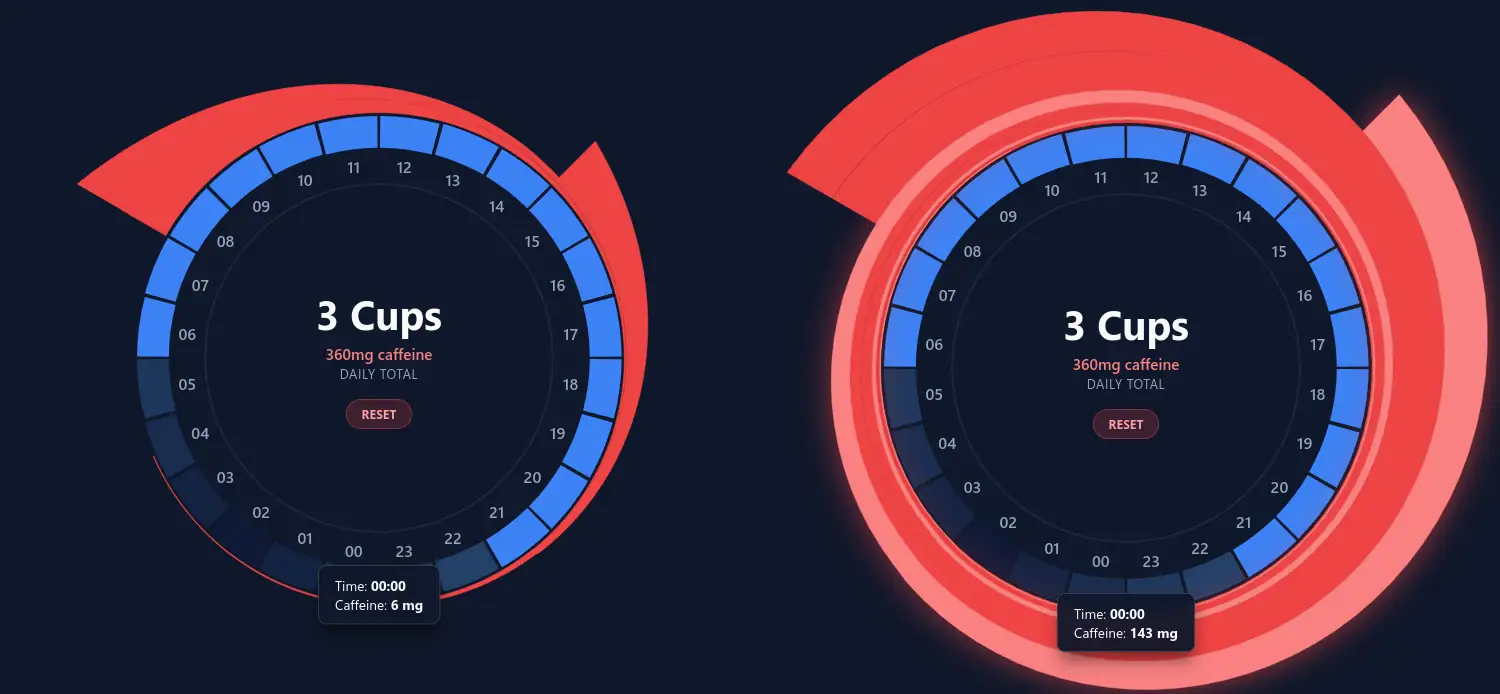
At some point, curiosity turned into a small coding project. Assume a short ~2.5 hour half-life. A decent morning cup (~120mg) drops to 30mg in five hours. Meanwhile, an average guy with a standard 5-hour half-life is still circulating 60mg of caffeine. Add a second cup 30 minutes later, and a third in the afternoon, and the math starts to get messy. I needed a visual to fully grasp how things progress and a calculator to tell me the exact amount of caffeine still moving around my head as I pull that blanket over myself.
Let’s get technical
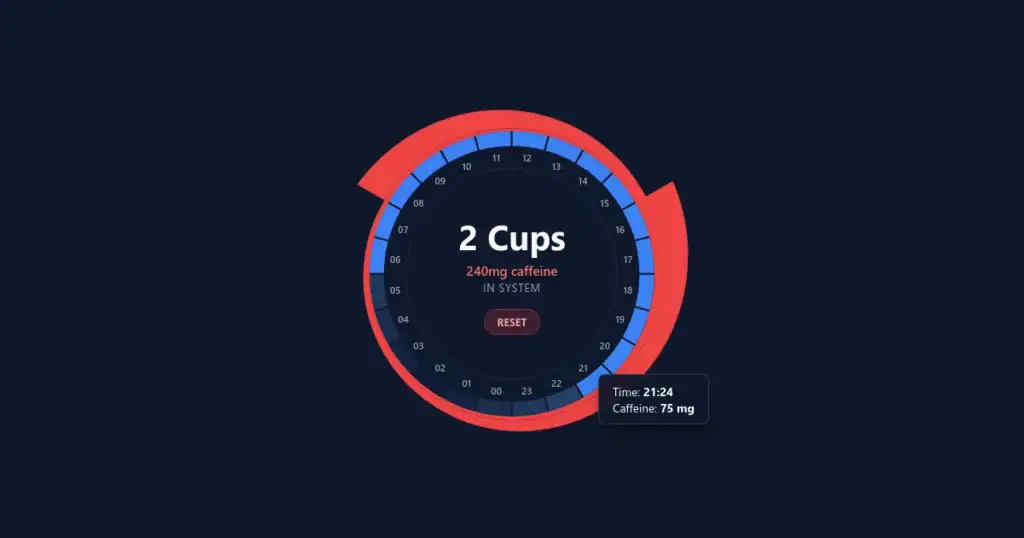
I visualized a 24-hour clock face. I wanted easy-to-click blue segments for adding drinks intuitively. A darker night-time portion. Clear graphs that go down as time passes, showing detailed information under the cursor. Stylized visuals with specific colors that stack but differentiate with mouse hover. Plain HTML/CSS + JavaScript with SVG graphics to keep it simple and responsive. I wrote this down with OpenCode’s planning mode.
The LLM required a couple of nudges to get the math right. Twice I needed to abort the work from going off-rails and re-describe what I had in mind in a little more detail. The end results were janky, and the code needed a few fixes before the spiral-like caffeine graphs settled nicely on top of each-other along the clock face. Initial implementation API costs were under $3 in about thirty minutes. Fixes, additions and tweaks included, fun times cost me $6.82. Perhaps a couple of hours with some light reading on metabolism. The AI still needed someone who understood programming and could troubleshoot things down to the CSS declarations, and I fixed some things by hand because it felt quicker than writing an essay on what I wanted, but all-in-all, I’m impressed.
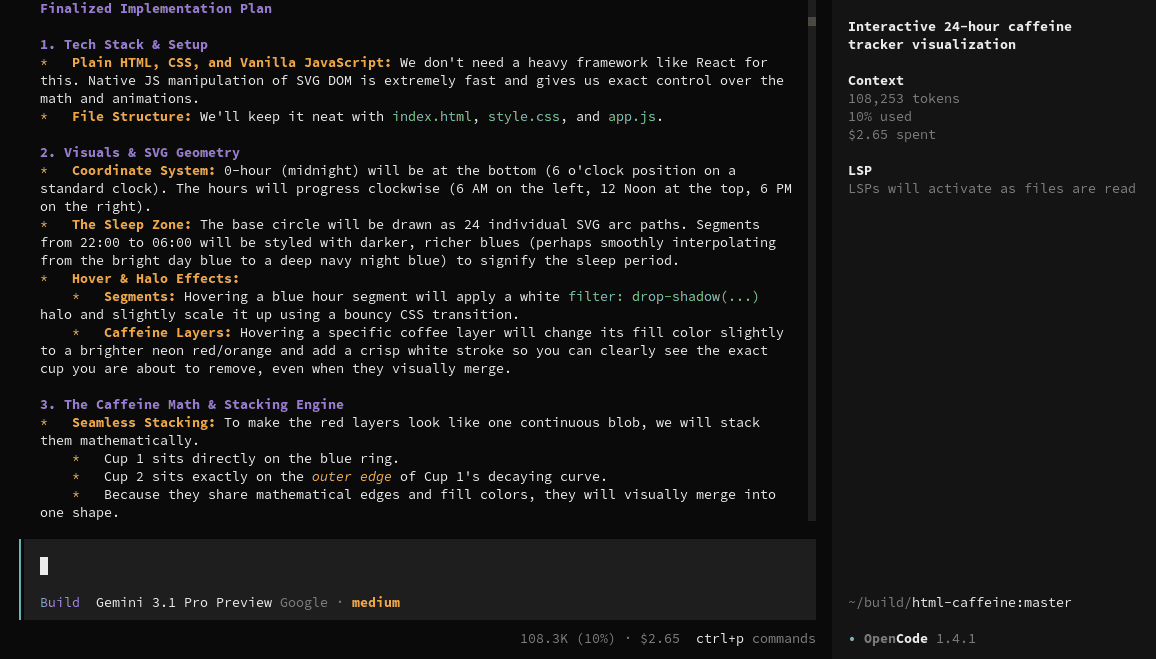
This was a great chance to test out OpenCode and Gemini 3.1 Pro with a small project from start to finish.
Goals and Features
- Simple architecture: No server-side features, fast and simple. Might be worthwhile to separate the ~400 lines of JavaScript code into multiple files, if I continue development—both for LLM context savings and general sanity.
- Simple clean visuals with pretty colors: I like it. The finished product matches what I had in my head pretty well. The original thin segments looked cooler, but my big fingers kept missing the mark on mobile. I think the spiral graphs turned out well.
- Ease of use: Not sure how many people find the extra info button on the bottom and the extra settings behind it. I don’t want to add analytics to find out. I find the UI intuitive and quick to use.
- Privacy: No data collection, server side functions. I did add a cookie with a lifetime of one week, that only gets created if you change settings—I got tired of re-entering numbers. It’s opt-in and required for the saving functionality. I do count visitors anonymously using Counter.dev and host on Github Pages (Microsoft), but neither see the client-side coffee numbers.
- Scientific accuracy: Good enough, I guess. I decided to publish the app with a default half-life of 4.5 which I figured sits in the middle range for normal healthy people without anything special affecting their liver function, but I added customization options for smokers and people like me, who know they metabolize caffeine faster (or slower) than average. Of course, the numbers are still a bit hand-wavy. Still, I think it’s a close enough approximation to give a general idea (especially visually) about how long trace amounts of caffeine stay in your body.
- OpenCode from start to finish: Pretty much. Aside from screen captures, quick icon editing, and writing some content directly, OpenCode handled the code. As long as the prompting was detailed enough, the AI managed the heavy lifting without issue.
- Utility: I was genuinely surprised to see just how long those caffeine graph tails get. The app provides a dead-simple visual way to simulate different coffee drinking cadences. It probably won’t be a daily driver, but I learned a lot doing it, and the tool will stay online for me to refer back to on my next latte-heavy day.
Dive deeper and view the source: https://github.com/jnaskali/caffeine-tracker
- Mazeaud, S., Castellana, F., Coelho-Junior, H. J., Panza, F., Rondanelli, M., Fassio, F., … & Sardone, R. (2022). Coffee drinking and adverse physical outcomes in the aging adult population: a systematic review. Metabolites, 12(7), 654. https://doi.org/10.3390/metabo12070654[↩]
- Higdon, J. V., & Frei, B. (2006). Coffee and health: a review of recent human research. Critical reviews in food science and nutrition, 46(2), 101-123. https://doi.org/10.1080/10408390500400009 [↩]
- Ishii, M., Ishii, Y., Nakayama, T., Takahashi, Y., & Asai, S. (2020). 13C-caffeine breath test identifies single nucleotide polymorphisms associated with caffeine metabolism. Drug metabolism and pharmacokinetics. https://doi.org/10.1016/j.dmpk.2020.03.003[↩]
- Grzegorzewski, Jan, et al. Pharmacokinetics of caffeine: a systematic analysis of reported data for application in metabolic phenotyping and liver function testing. Frontiers in pharmacology 12 (2022): 752826. https://doi.org/10.3389/fphar.2021.752826 [↩][↩]